Contact us for more information about our solutions
UMMs & High-Speed Events
UMMs (Urgent Market Messages) provide essential information on outages, both planned and unplanned, that reduce the generation, transmission, or consumption capacity of a plant, unit, or interconnector. Combined with ultra-fast high-speed event detection, traders gain a critical edge in short-term markets.

High-speed events
Detect ultra-fast interconnector and power station trips up to 15 minutes faster than REMIT publications, giving short-term traders a crucial time advantage.
Detailed outage information
Get per-unit outage data across short- and medium-term horizons, available directly through the visualisation tools in Insight's web app.
Uniform data access via API
Access multiple data sources translated into a consistent curves package for each area, ensuring uniformity and simplicity in workflows.
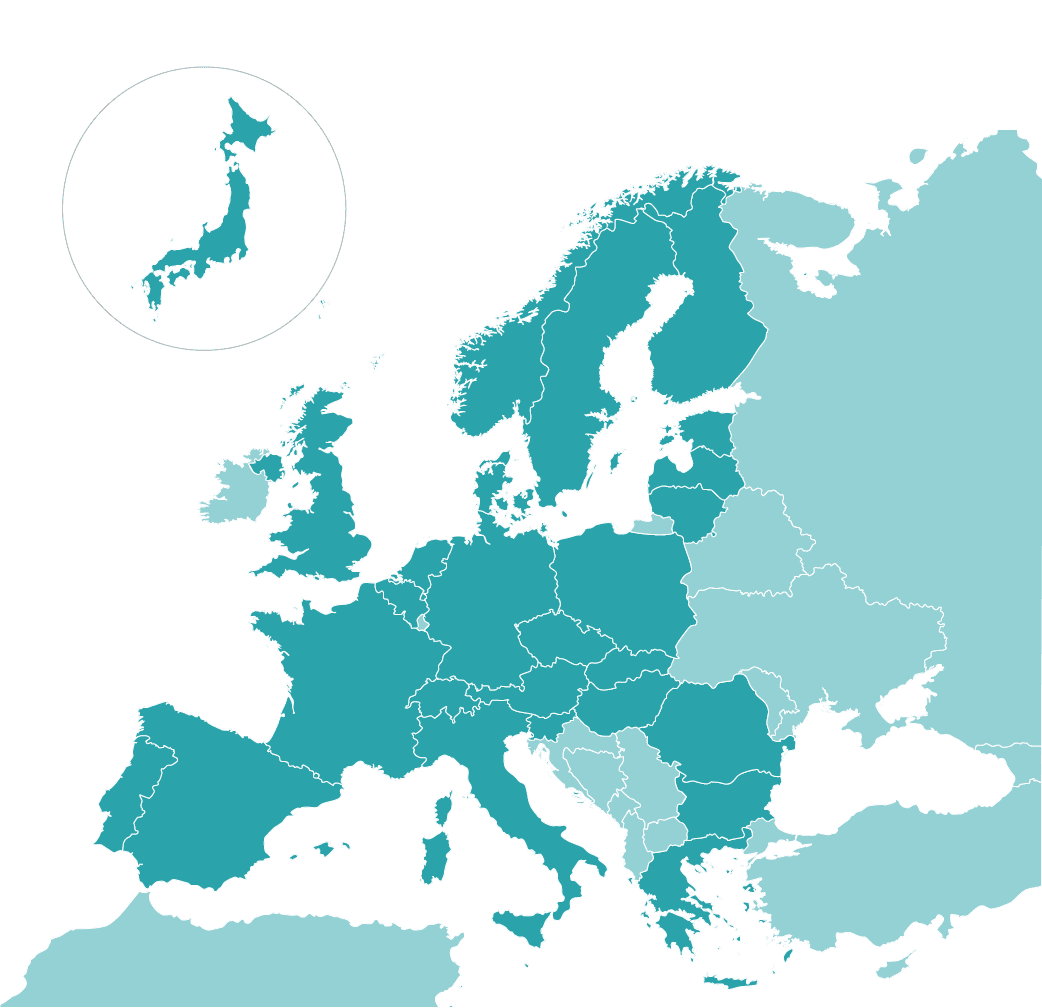
Available regions

Ahead of the game with technological advantages
Extensive data history
Leverage historical data via API with instance curves that track changes over time, improving transparency and modelling accuracy.
High-resolution data
Leverage 15-minute granularity to precisely track capacity changes and outage impacts.
Real-time updates
Receive refreshed data within 5–15 minutes of UMM publication, ensuring timely, accurate insights for rapid decision-making.
Wide coverage
Access outage and event data covering more than 20 countries across Europe, the UK, and Japan.
Integrated alerts
Receive real-time ticker notifications for high-speed events directly in Insight’s web app to enable instant action.
Contact us for more information about our solutions
Do you want to learn more about our UMMs & high-speed events?
See how fast and structured UMM alerts help you react to market-moving events with confidence and speed. Get in touch to book a demo, request a free trial, or speak with one of our experts.

Mats Zachariassen, Solution Sales Expert at Insight by Volue